
Guide: Building a Chrome Network Listener
Building a Chrome extension to listen to network requests.

Risky Business
Most modern browsers offer a wide array of extensibility options in the form of extensions (sometimes called plugins). Extensions are generally obtained through an extension marketplace such as Chrome Web Store (for Chrome) and Firefox Browser Add-ons (for Firefox).
A major concern however with extensions is trusting them. For most people, going to a web store and clicking “Add to Chrome” and accepting any permissions needed is about a deep interaction outside the extension they will go to. This is reasonable behavior, but risky. This risk is magnified greatly if you install extensions from third party marketplaces as well as one-off extensions, like the one we are making today!
For more information on Chrome extension packaging, look up the CRX format.
Basic Architecture
Today’s post is an iteration of “Guide: How to Build a Simple Chrome Extension”. If you have never built an extension locally before please give it a read to get your footing.
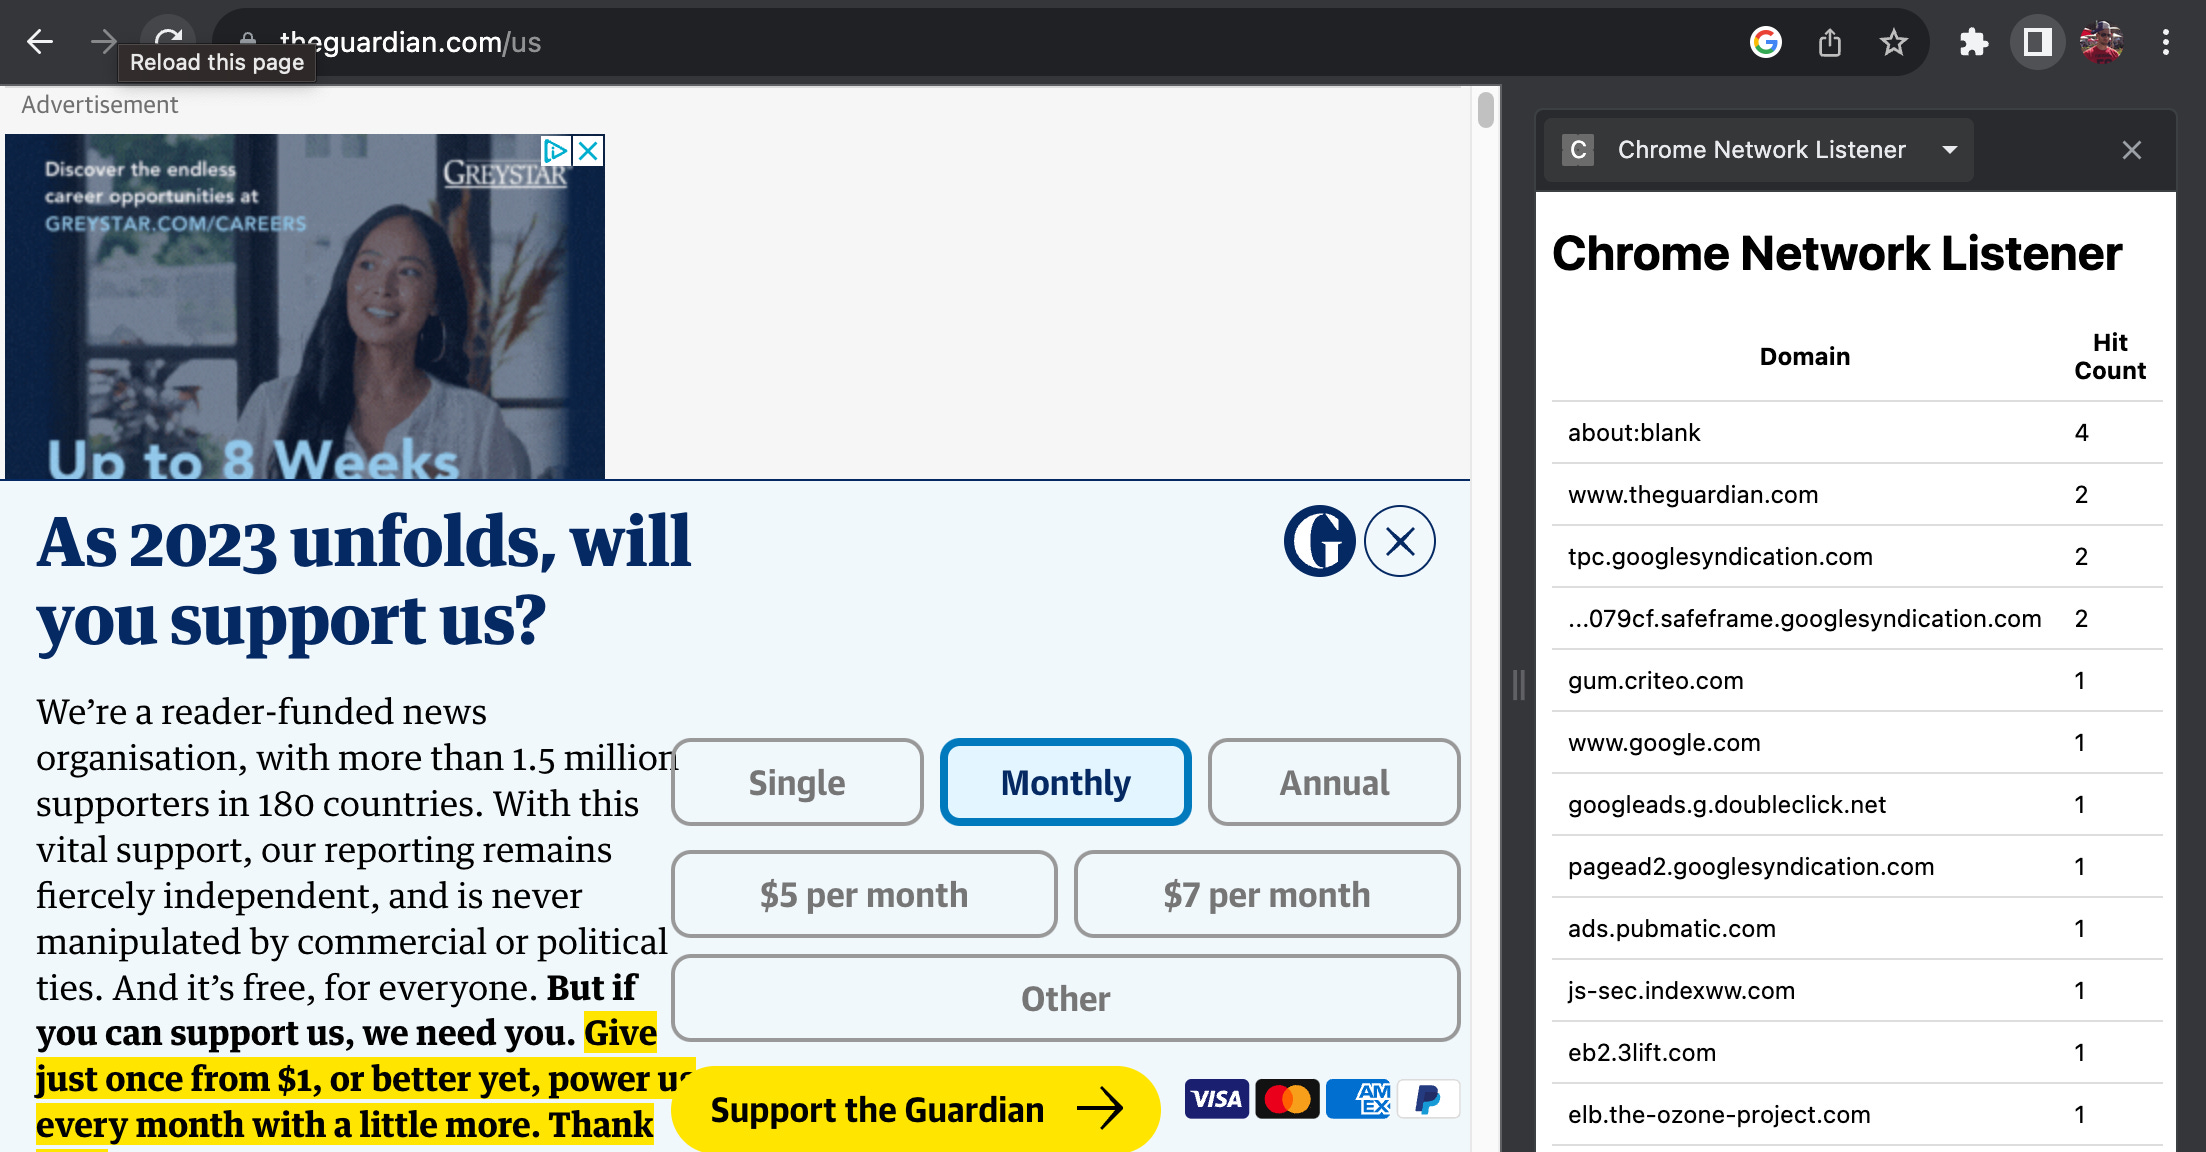
It’s one thing to capture data, it’s another to visualize it. The goal of the extension is to not only capture requests made by Chrome as requests complete, but also clearly display them so you can possibly take some action. What kind of action? Perhaps you have a local firewall and you like to block some particular tracker. This extension will show you the precise domain the request is being made out toward.
The general file layout will remain the same as our previous extension:
manifest.json file.
popup.html file.
content.js script (unused but required).
README.md (not a Chrome extension requirement, rather for GitHub).
However there are some new files we need for the additional functionality. What are those?
background.js in the scripts directory. This is where we will capture the data.
sidepanel.html. How we will visualize our extension, via Chrome Side panel functionality.
sidepanel.js. A script we will use to receive messages from background.js. We then take those messages and display the data in sidepanel.html.
Let’s talk about what is going on with these files one by one.
manifest.json
This file is the heart of the configuration to your extension. Key (new) items required for our extension:
permissions. We will need two new permissions:
webNavigation: Required for background.js (our background worker) to interact with the chrome.webNavigation API.
sidePanel: Required permission to interact with the Chrome Side panel functionality.
side_panel:
default_path child key with a value of sidepanel.html. This is so Chrome knows what HTML file to display in the side panel.
scripts/background.js
background.js is the background worker of our extension. This file will work in tandem with the Chrome APIs available behind the scenes to obtain data, and your visualization components (which in our case is the side panel we are building, but more generically with content.js scripts that interact with the pages rendered).
This file (available in GitHub) essentially flows like:
Initialize some variables (domainData and urls) used to track where our requests are going.
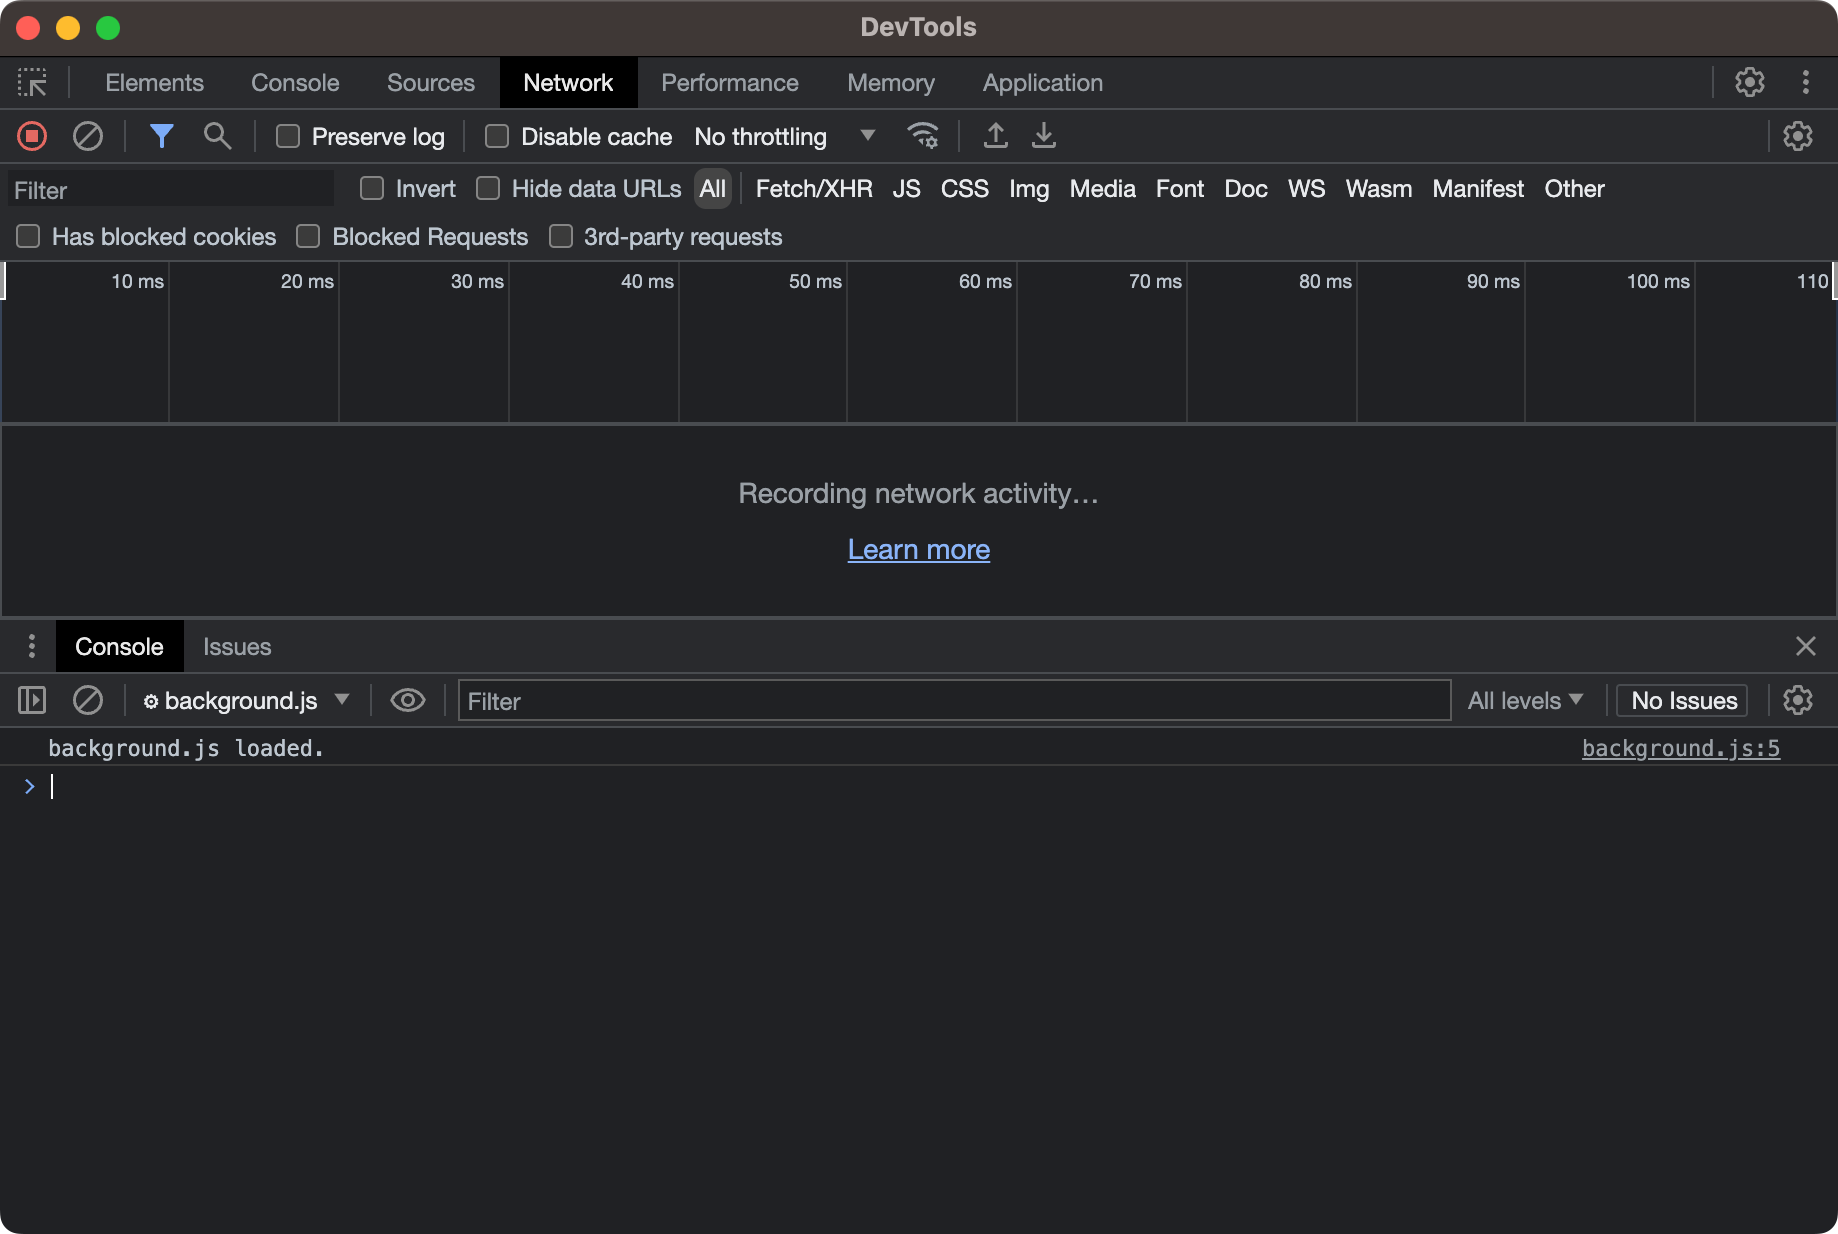
Print a message to the console that the background.js is loaded (more on debugging later).
Register a listener. Once registered, listen for webNavigation requests to complete, process them to get the base domain of the URL, and save that data locally. Send the updated key/value object (domain and how many times it was hit) to sidepanel.js,
What is a Listener?
An extension’s files have restrictions based on permissions, which define what functionality goes where.
A background worker is specifically prevented from accessing the page’s DOM. What it is allowed to do is interact with the various browser APIs behind the scenes. In our case, we want to add a listener to a specific event. A listener is specifically a function registered to listen for one or more events in the lifecycle of an API.
To listen to general network activity, we want to listen for the “onCompleted” event. To add a listener to this event, we add code that looks like this:
chrome.webNavigation.onCompleted.addListener();Our function will be passed anonymously to it. Essentially we know some data will be passed to the function when “onCompleted” is emitted. We can call this whatever we like, so for now I named this parameter “details”. So now the generalized structure, and adding printing of this data out in a format you can see, would like like:
chrome.webNavigation.onCompleted.addListener((details) => {console.log(JSON.stringify(details)});Debugging background.js
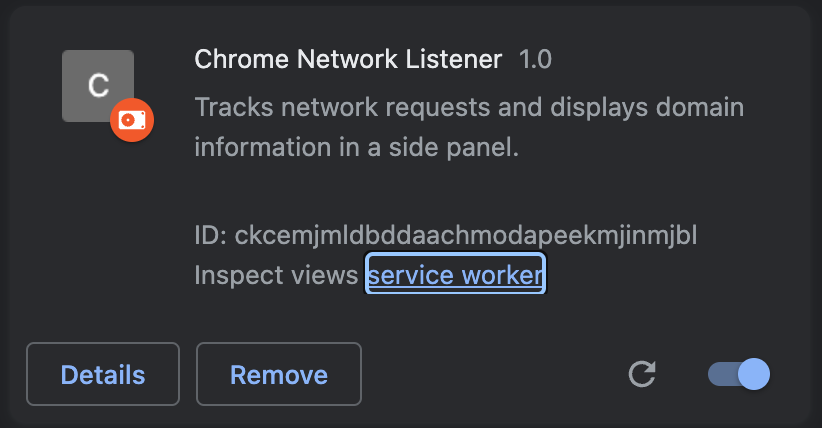
How do we debug the background.js file? Unlike debugging a web page simply by opening the Developer Tools feature, you need to fire off a separate instance for background.js. To do this (presuming you have loaded your extension already):
Navigate to chrome://extensions.
In Inspect views click “Service worker”.

Extensions view to launch DevTools for background.js.
This will open a dedicated DevTools instance, like this:
background.js Functionality
As noted in the flow earlier, code in this anonymous function is where we will slice and dice the url property from the “details” data sent to our function once onCompleted fired for a given request.
Key items to note here:
Grab the url and obtain the hostname.
NOTE: Some resources will fail, some will be from cache, some will be malware, etc. Meaning the URL might not contain a proper hostname property. In this case we use the entire url. Example is “about:blank”.
Save the parsed value as
domainand add it to theurlobject.Increment the hit count if we have seen this domain before.
Order the domains by number of hits each as received so we can see most to least in the side panel.
Send this ordered data object to the sidepanel.js file, by utilizing
chrome.runtime.sendMessage(sortedDomainsByCount).
sidepanel.html
To visualize our data, we need somewhere to place it. As we opted to use the Side panel functionality of Chrome, we simply need to create a basic page. For this extension we are simply making a labeled table, that looks like this:
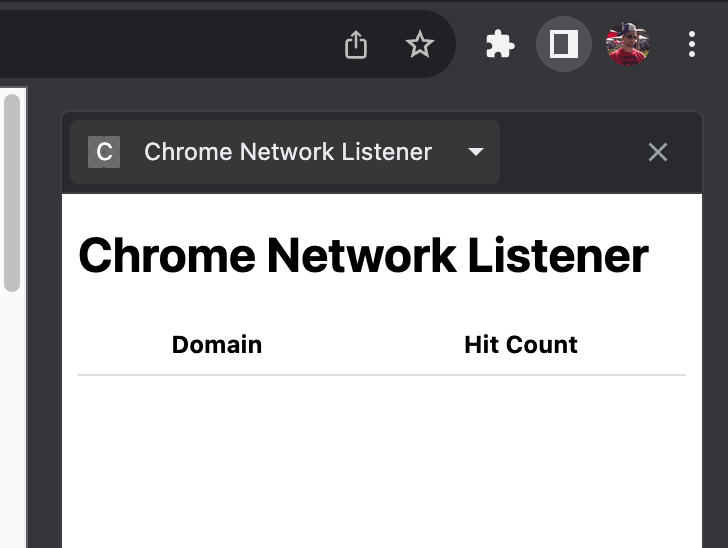
Aside from visualizing, it’s critical to note, in this HTML is where we refer to sidepanel.js, the JavaScript script we will use to receive information from the background.js worker and update our HTML to view the data.
sidepanel.js
The flow of sidepanel.js is:
Log the file was loaded.
Add a listener, this time for the onMessage event.
A helper function for better visualization.
To add more color to what’s happening here. When we receive a message from the background worker, we want to take the data passed to us, and use it in our anonymous function. We will take that data, re-render the table back to its default state (as with each onComplete we fire out an updated url object.
DOM Accessibility
As noted earlier, different scripts have access to different API functionality based on their permissions. sidepanel.js works much like a content.js script, it has access to the DOM. In this case, not a regular web page’s DOM but instead the DOM of our sidepanel.html.
This allows us to manipulate the HTML directly. In our case we simply add a new row to the table, and in the first column add the domain, and the second add the count.
Visualization Tweak
Some domains (especially due to subdomains) get really long. This will cause the side panel to add a horizontal scroll bar and push the counts off the screen pretty quickly. This is not ideal behavior. A basic remedy we can do is truncate the values.
This is why we added the truncateDomain(domain) method. It is currently designed that:
If a domain has more than 30 characters, and more than 2 segments (meaning it detected at least two periods in the domain)…
Grab the subdomain and grab its last five characters…
Then return the subdomain prefixed with “…”, and reattach to the base domain.
Not a perfect solution, but intended to show how to make a basic visualization a bit better.
Security
This post is by no means complete in terms of security, but there are several security related items to observe here:
This extension is watching aspects of your network traffic. It’s intended to show how this type of activity is possible.
Changing the data. While we simply parsed the domains for visibility, it shows how data can be changed, aggregated, etc before being sent.
The extension is not limited to any one URL, meaning once installed and active, it listens to all instances of Chrome and all tabs within (with exception of incognito tabs, which could be watched as well but require a special property to do so). This is done via a config in the manifest.json:
"content_scripts"."matches": ["<all_urls>"]Data is captured temporarily, locally. Per the source code in GitHub you will see this data is not stored in any local data store (cookies, database, etc), or sent off on the network to a third party service. That is the next step an extension would take to capture your data on a more permanent basis.
Wrap Up
This post is not to scare you from ever using extensions. It was intended to give a sense of what is possible, how to do actionable and realistic things with an extension and give you pause for concern of what could go wrong. Extensions are a great way to make your day to day life easier! Like all things tech related, be mindful of the security implications, for your data, and others!
The code for this post can be found on GitHub here.