
Guide: Creating a Dune Dashboard from Scratch
How to create a Dune dashboard via Dune SQL to gain insights on Ethereum based data.

Overview
Dune provides both free and subscriptions users a robust analytics dashboard service, to query and visualize blockchain data. This post is not about learning the basics of crypto, rather to expose how to start using Dune.
To sign up for a free account go to https://dune.com.
Terminology and Basic Concepts
If you are new to Dune, there are some terms and ideas to get familiar with.
Terminology
DEX - Decentralized exchange, a peer-to-peer marketplace for trading cryptocurrencies, without the middle-man.
DuneSQL - The Dune query engine, forked from TrinoSQL (an open-source distributed SQL query engine).
Concepts
Data that has been made available in Dune come from the blockchains themselves. However, there are currently four variants of this sourced data:
Raw data, the actual raw data from the blockchains.
Decoded data, smart contract data that is unedited but now viewable.
Spellbook, edited data tables, either by Dune or the community, to make it easier to work with.
Community data tables enhanced by the community to include both on and off blockchain data.
Public Examples
Before getting into building your first query and dashboard, I suggest you go and view some pre-existing dashboards and how they are built.
You can find them here. Here you can not only view the public dashboards, but by clicking the label in the top left of a chart will display the DuneSQL that powers it.


Also, you can click on the Queries tab to just jump to viewing queries if you prefer.
Getting Started
One you have signed up for your account, your initial profile Library screen will look similar to this:
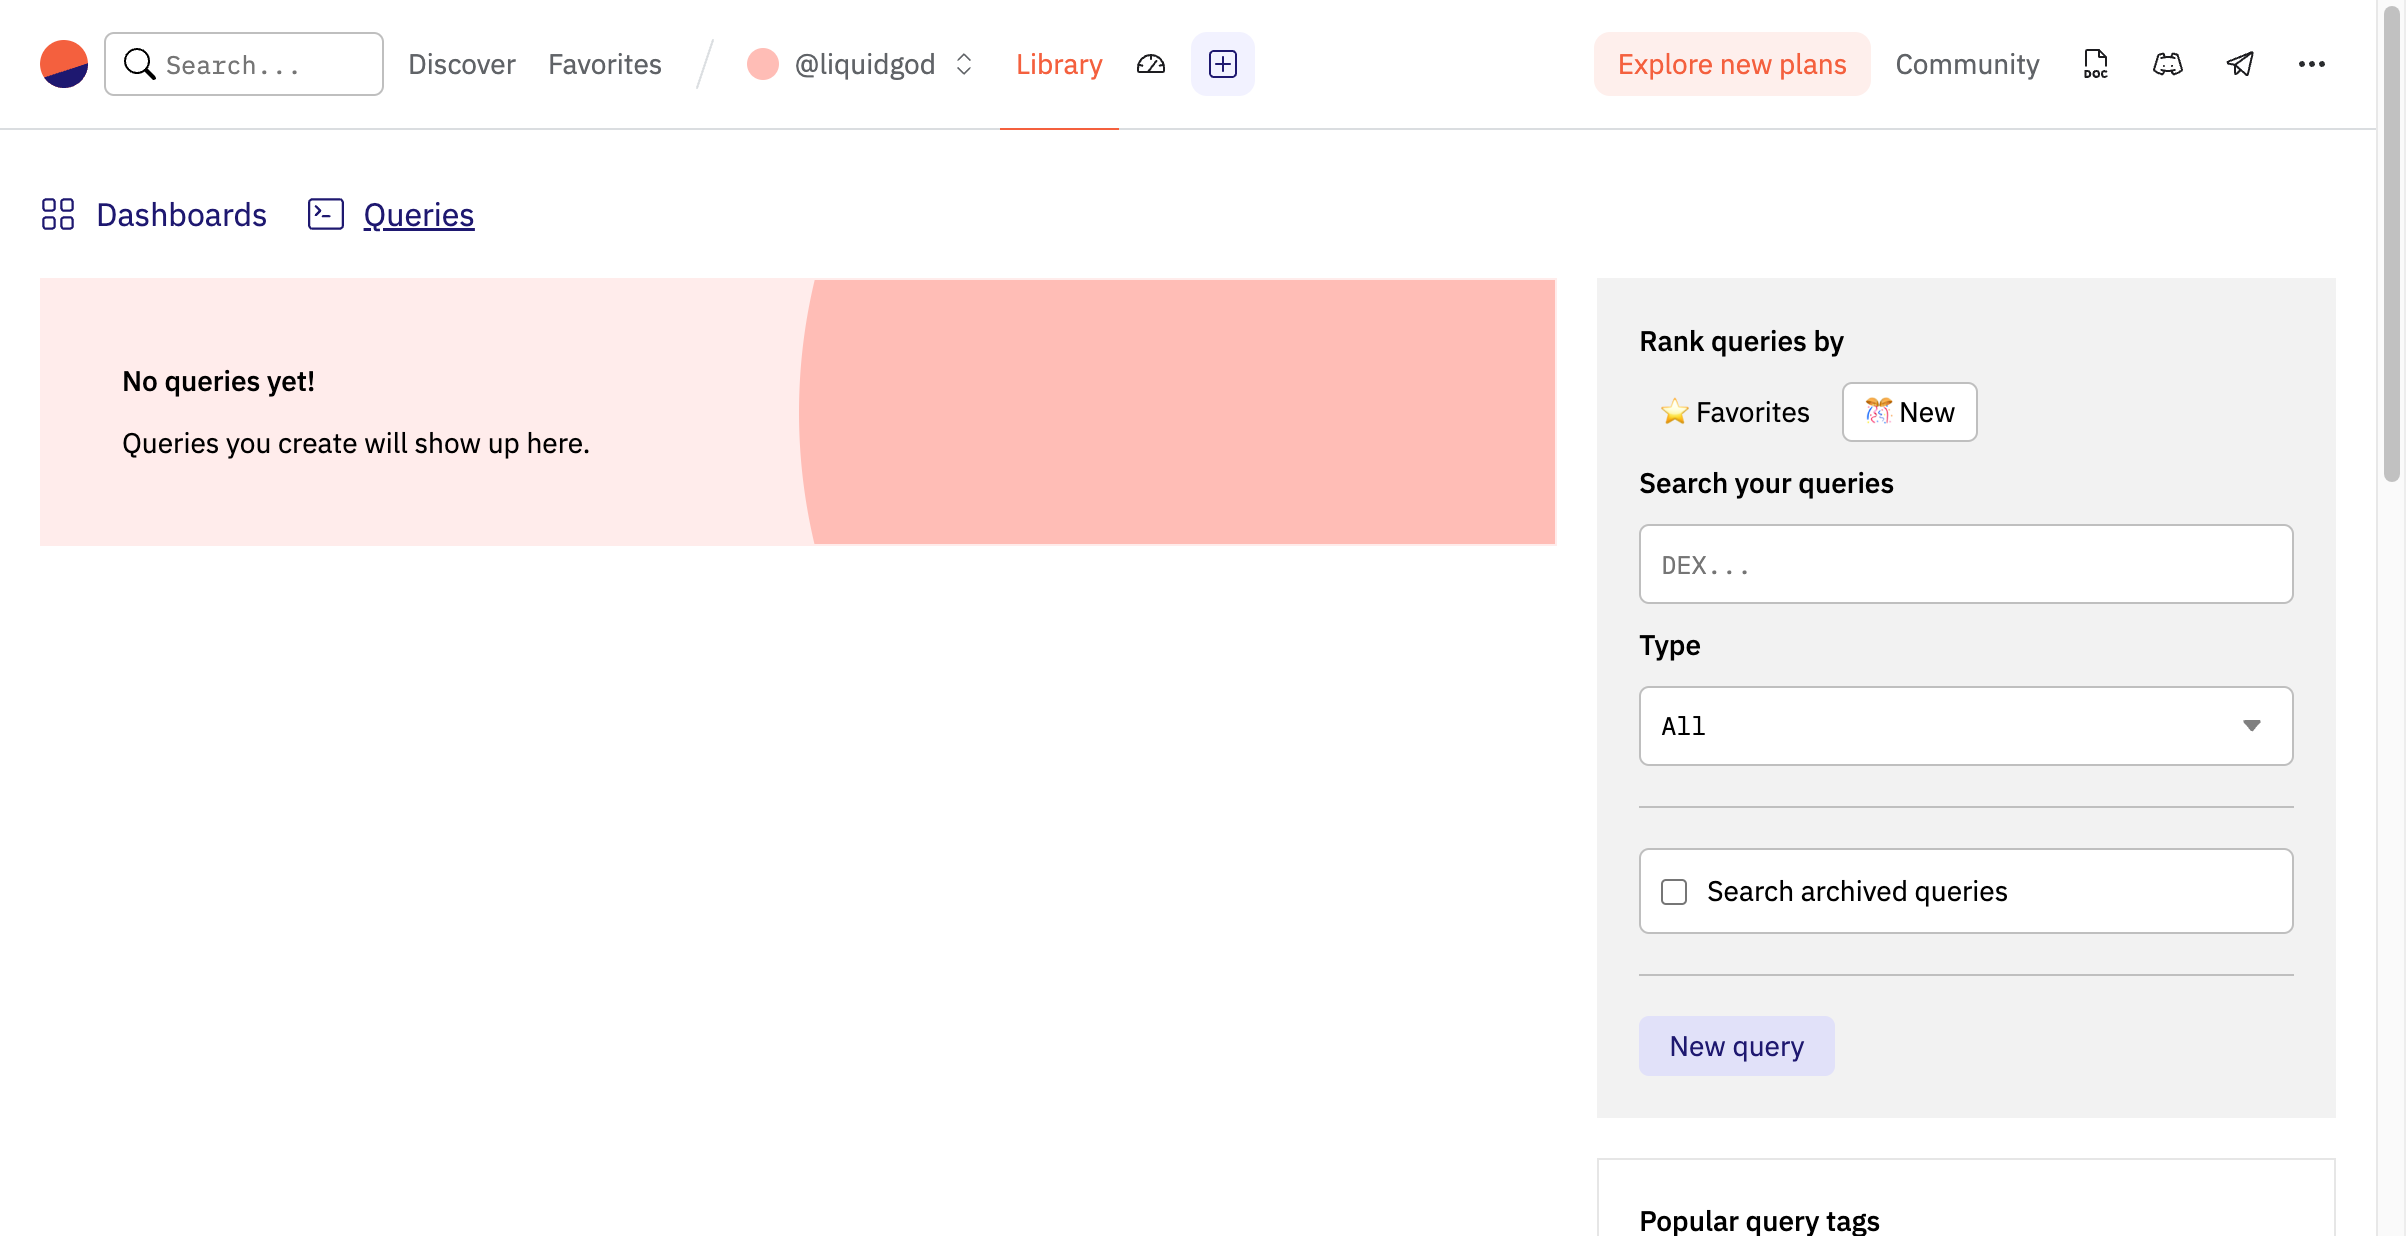
This screen will allow you to create new queries, new Dashboards, search existing queries, etc. While you could start a Dashboard, it wouldn’t be much use without some data, so we will start with a simple query first. Click “New query”.
Your First Query
Hello Ethereum Transactions
The current default query editing screen will look something like this:

From here, you will use essentially basic SQL to build your first query and insight into whichever dataset you start with. There are a wide variety of datasets (and growing) so we will make two sample queries to get a sense of what you can do.
For the first example we will focus on Ethereum transactions.
Hello Ethereum
To build the initial “Hello Ethereum” query, you will take the following steps:
Under the “Browse datasets by category”, select “Raw”.

In the “Filter tables…” textbox, type “Ethereum”.
Click “ethereum transactions”, which represents the transactions table inside the ethereum dataset.
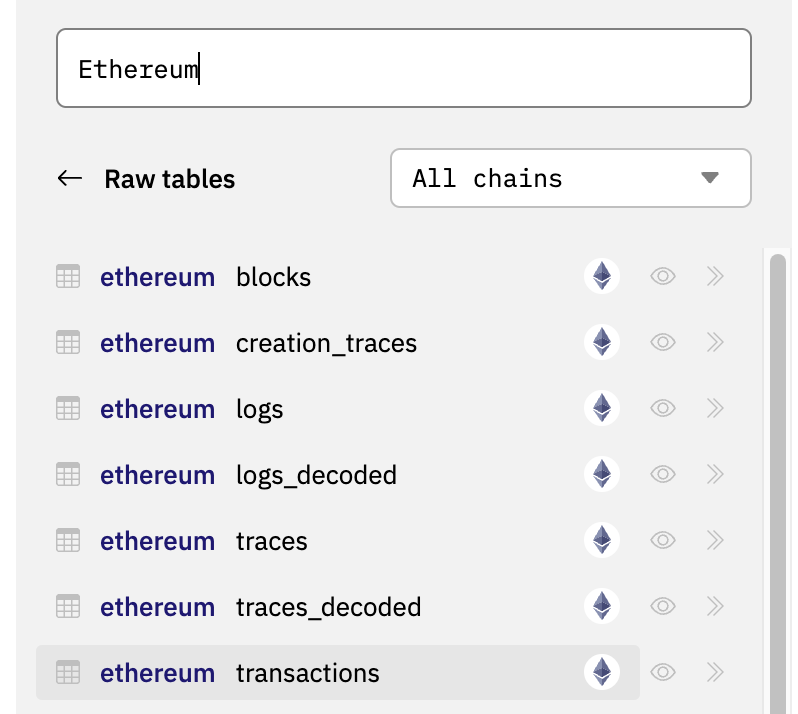
Click this data table will now show you a tabular view of the columns available in the table. Clicking a value there will autocomplete the field name into the SQL editor.
Now that we can see what data is available, lets create a basic query, shown here by typing this into the text editor that shows “Type some SQL here…”:

select * from ethereum.transactions
limit 2
This will now look like:
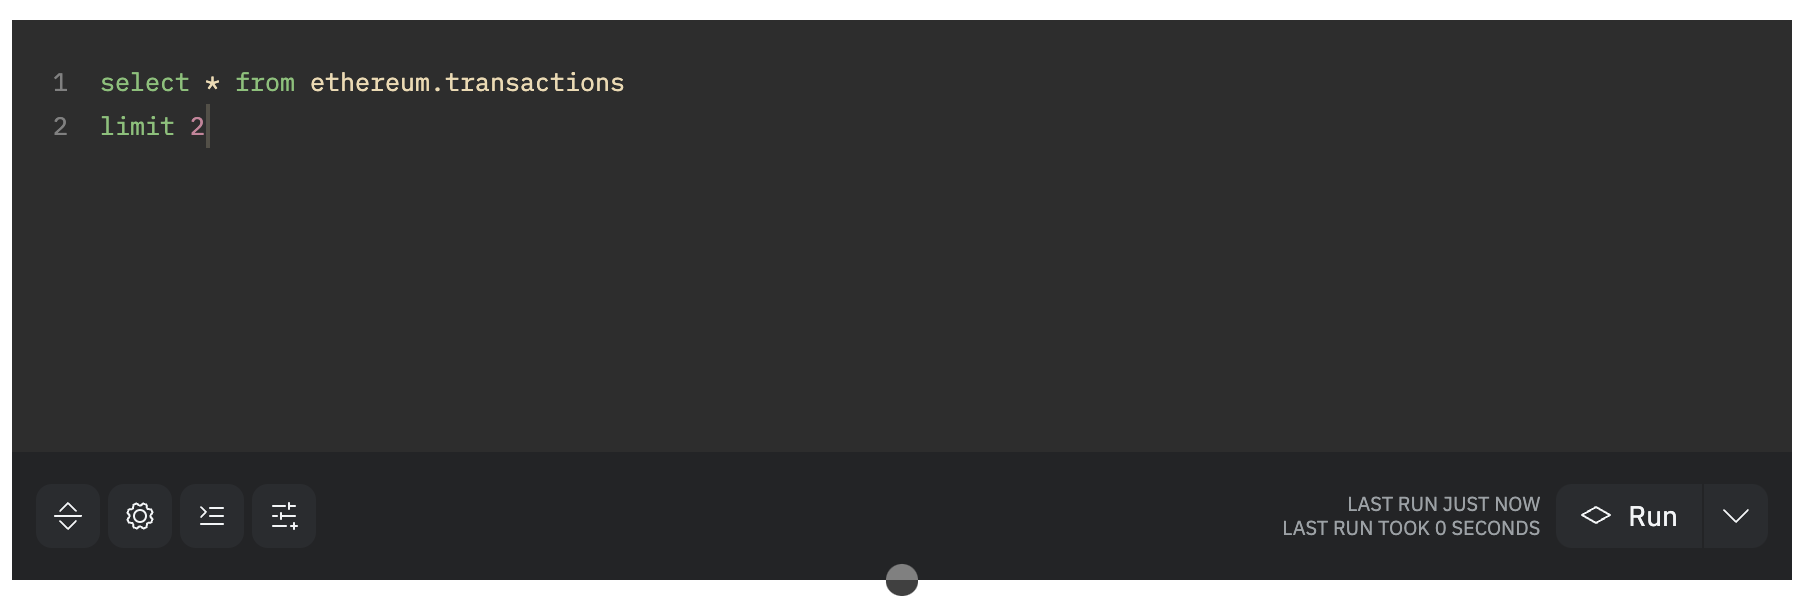
The above query is limited to avoid abusing free resources. This is a best practice in general, and definitely while figuring your queries out and testing them. (NOTE: You can select higher performing options in the run dropdown if you have a funded account.)
Click “Run”.
Barring any syntax errors, you will now get results in the “Query results” beneath the query editor:
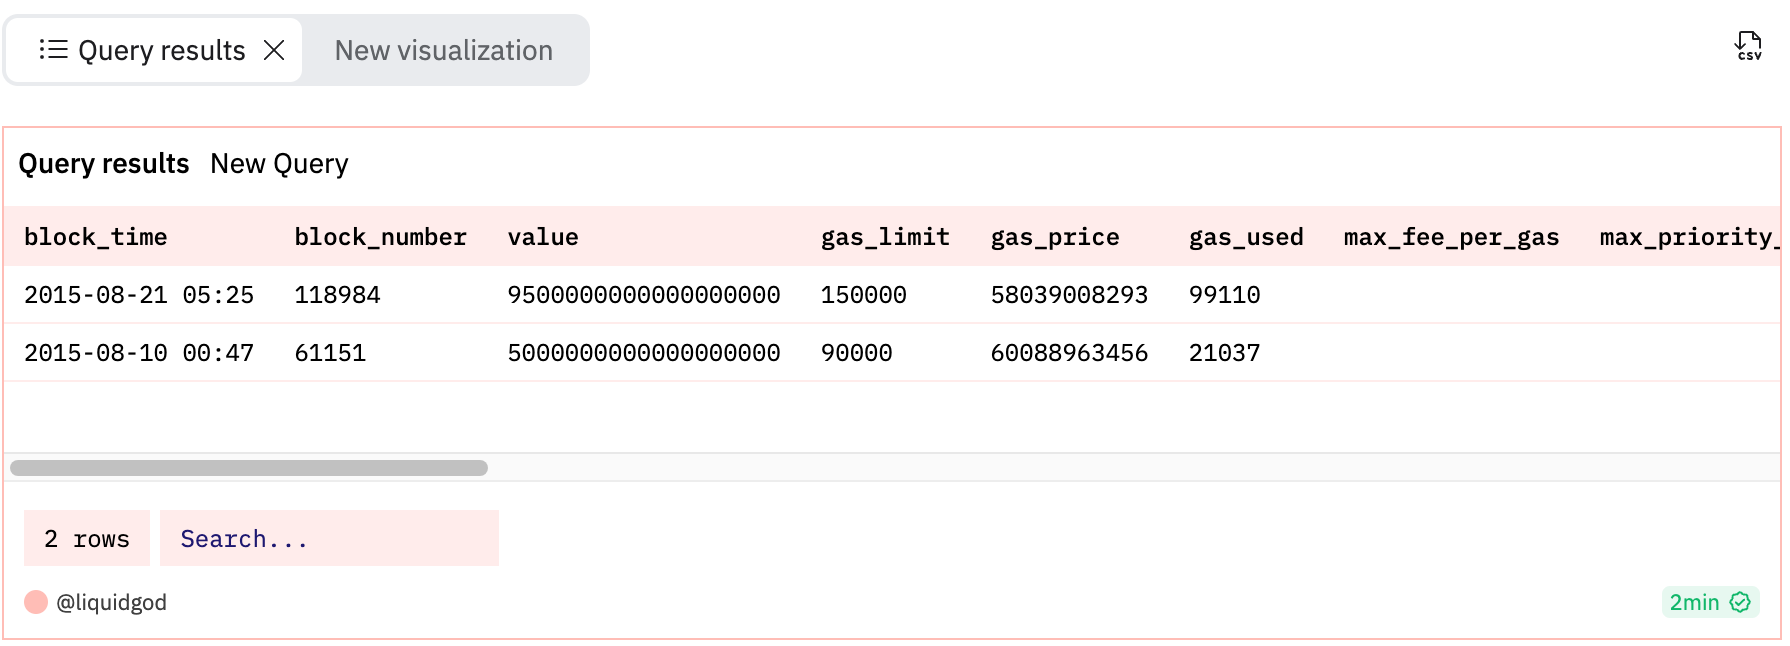
Presuming a result was given, now it’s time to save so we can use the query again, and use it to build up our dashboard.

Click “Save”.
Give it the name “Hello Ethereum Transactions”.
Click “Make private”, so we don’t pollute the public queries available while learning.
Click “Save”.
Once the save dialog goes away, your query editor will be updated to reflect this new query. If you click on your Library, you will now see “Hello Ethereum Transactions” listed in your Queries section. Let’s now make a second query.
Hello NFT Trades
For our second query we will look at the Essentials category NFTs dataset. From the Library screen click “New Query” to get back to the query editor.
Click Essentials under “Browse datasets by category”.
Select “nft trades” dataset table.
From here we’ll look at a bit more data, 10 rows this time. Your new query will look like this:
select * from nft.trades limit 10Again, the format is dataset.table. As before, click “Save” and name this query “Hello NFT Trades”, and mark it as private before clicking save again.
Creating a Dashboard
Now it’s time to use our two saved queries in a new custom dashboard. Very similar to the initial query we created, to create our first dashboard, you will:
Click “Library”.
Click “Dashboards”.
Click “New dashboard”.
Name the new dashboard “Hello Crypto Dashboard”.
Check “Make private”.
Click “Save and open”

The initial new dashboard will of course be empty as seen here:

From this juncture, it’s fairly straightforward to add your queries into this dashboard.
Click “Edit”.
Click “Add visualization”, your queries will populate the visualization dialog.
Click “Add” on both queries you have created. (NOTE: Please wait for each to complete, the label will switch to “Added”.)
Click “Done”.
Your dashboard will now show the tabular query result output, from your queries. In the following screen, I rearranged the tables simply by clicking the top of them and dragging into place.

From here, clicking “Done” will close out edit mode and you will have completed your first Dune dashboard, utilizing multiple datasets.
To see how to create your first visualization, check out Guide: Visualizations in Dune.
More Info
The best place to start is Dune itself, which offers a robust set of informational and communal resources.
Dune Documentation - The core documentation.
Dune Discord - The Dune Discord server.