
Chrome Extension DevTools Debugger Access
Details on how to gain access to the DevTools debugging experience for your extension.

This post is intended to help understand how to access the Chrome DevTools debugger from various aspects of your Chrome extension as it’s not always straight-forward.
It’s a an on-going culmination of learnings from my own Chrome extension development which you can read about in these earlier posts:


Launching DevTools by Extension Component
content.js (Content Scripts)
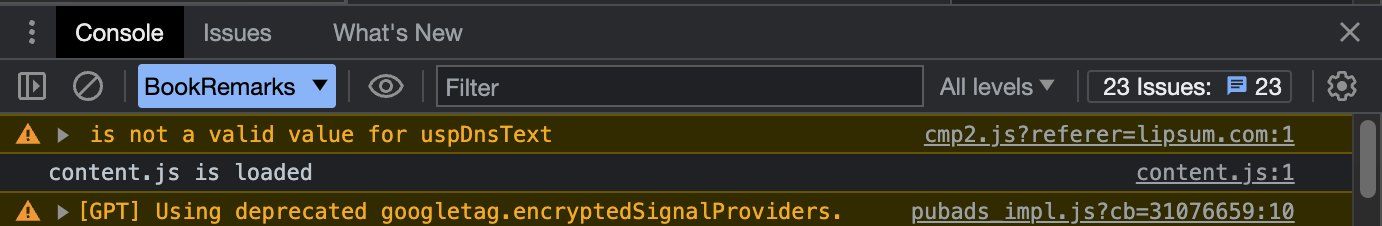
By default extension content scripts are excluded from the debugger so they are a bit difficult to find. I was not aware of this initially, so to find my content.js in an earlier project I used a trick to discover it. I placed a console.log() message at the top of your script, so when I opened the DevTools on the web page I was debugging, that message got me the link to the source file I needed.
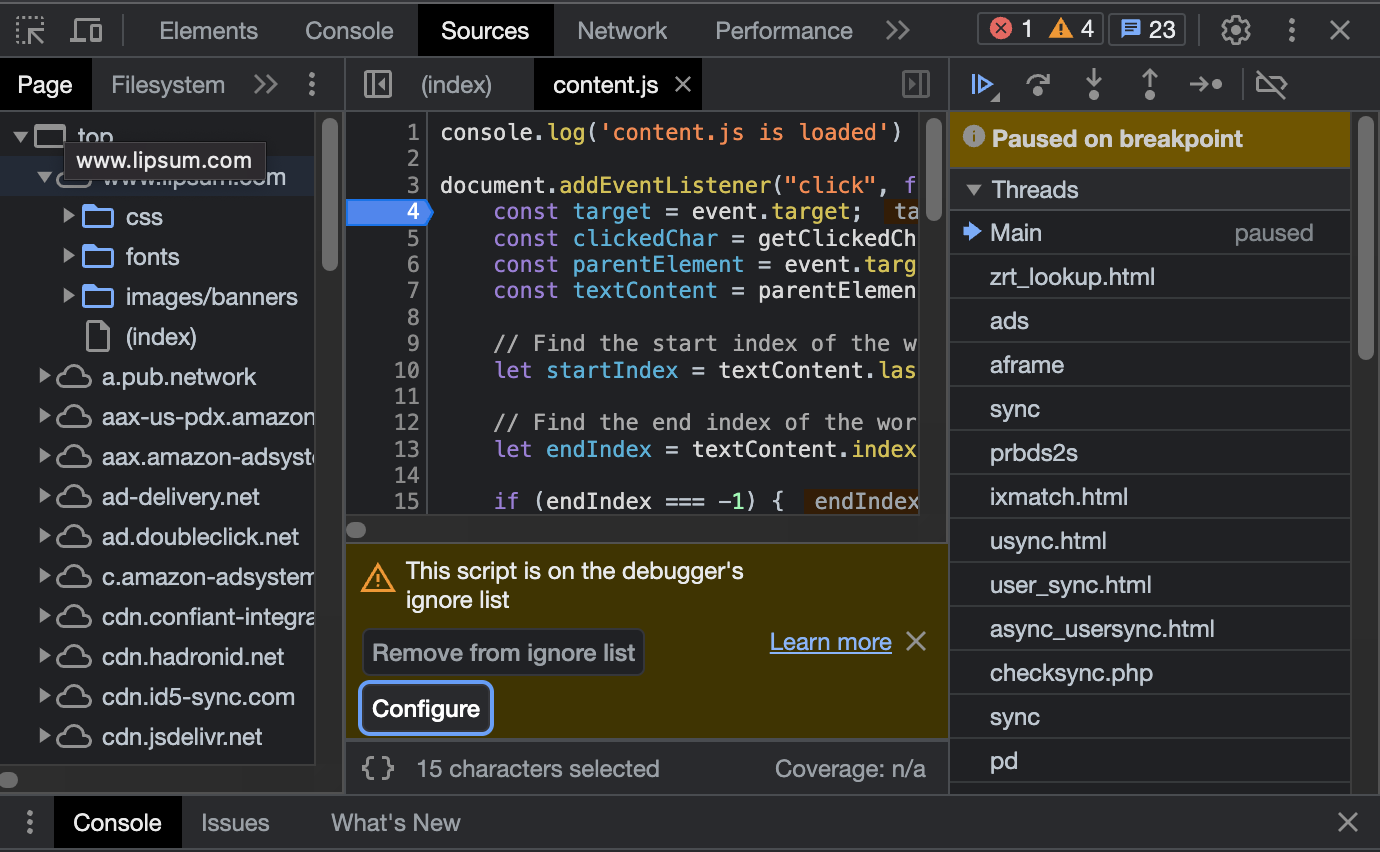
This gives you a hook, by clicking content.js, that will now open the Sources panel view of this file and prompt you to either remove from the ignore list or give you an option to Configure the list.
Here is a view of the script waiting on your decision:
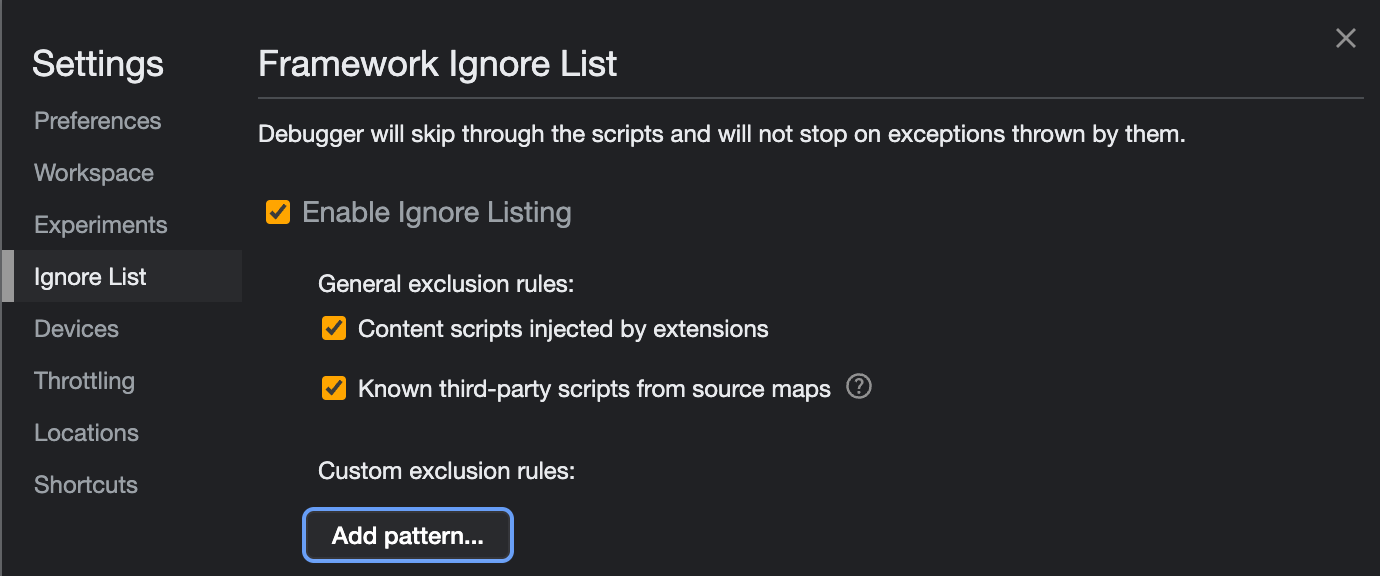
If you click Configure it goes to the DevTools Settings tab (which is the little gear icon on the right in the toolbar:

You also don’t have to make a choice here. You can now debug the file without changing your environment (for example you can now add a breakpoint and refresh the page and it will be hit).
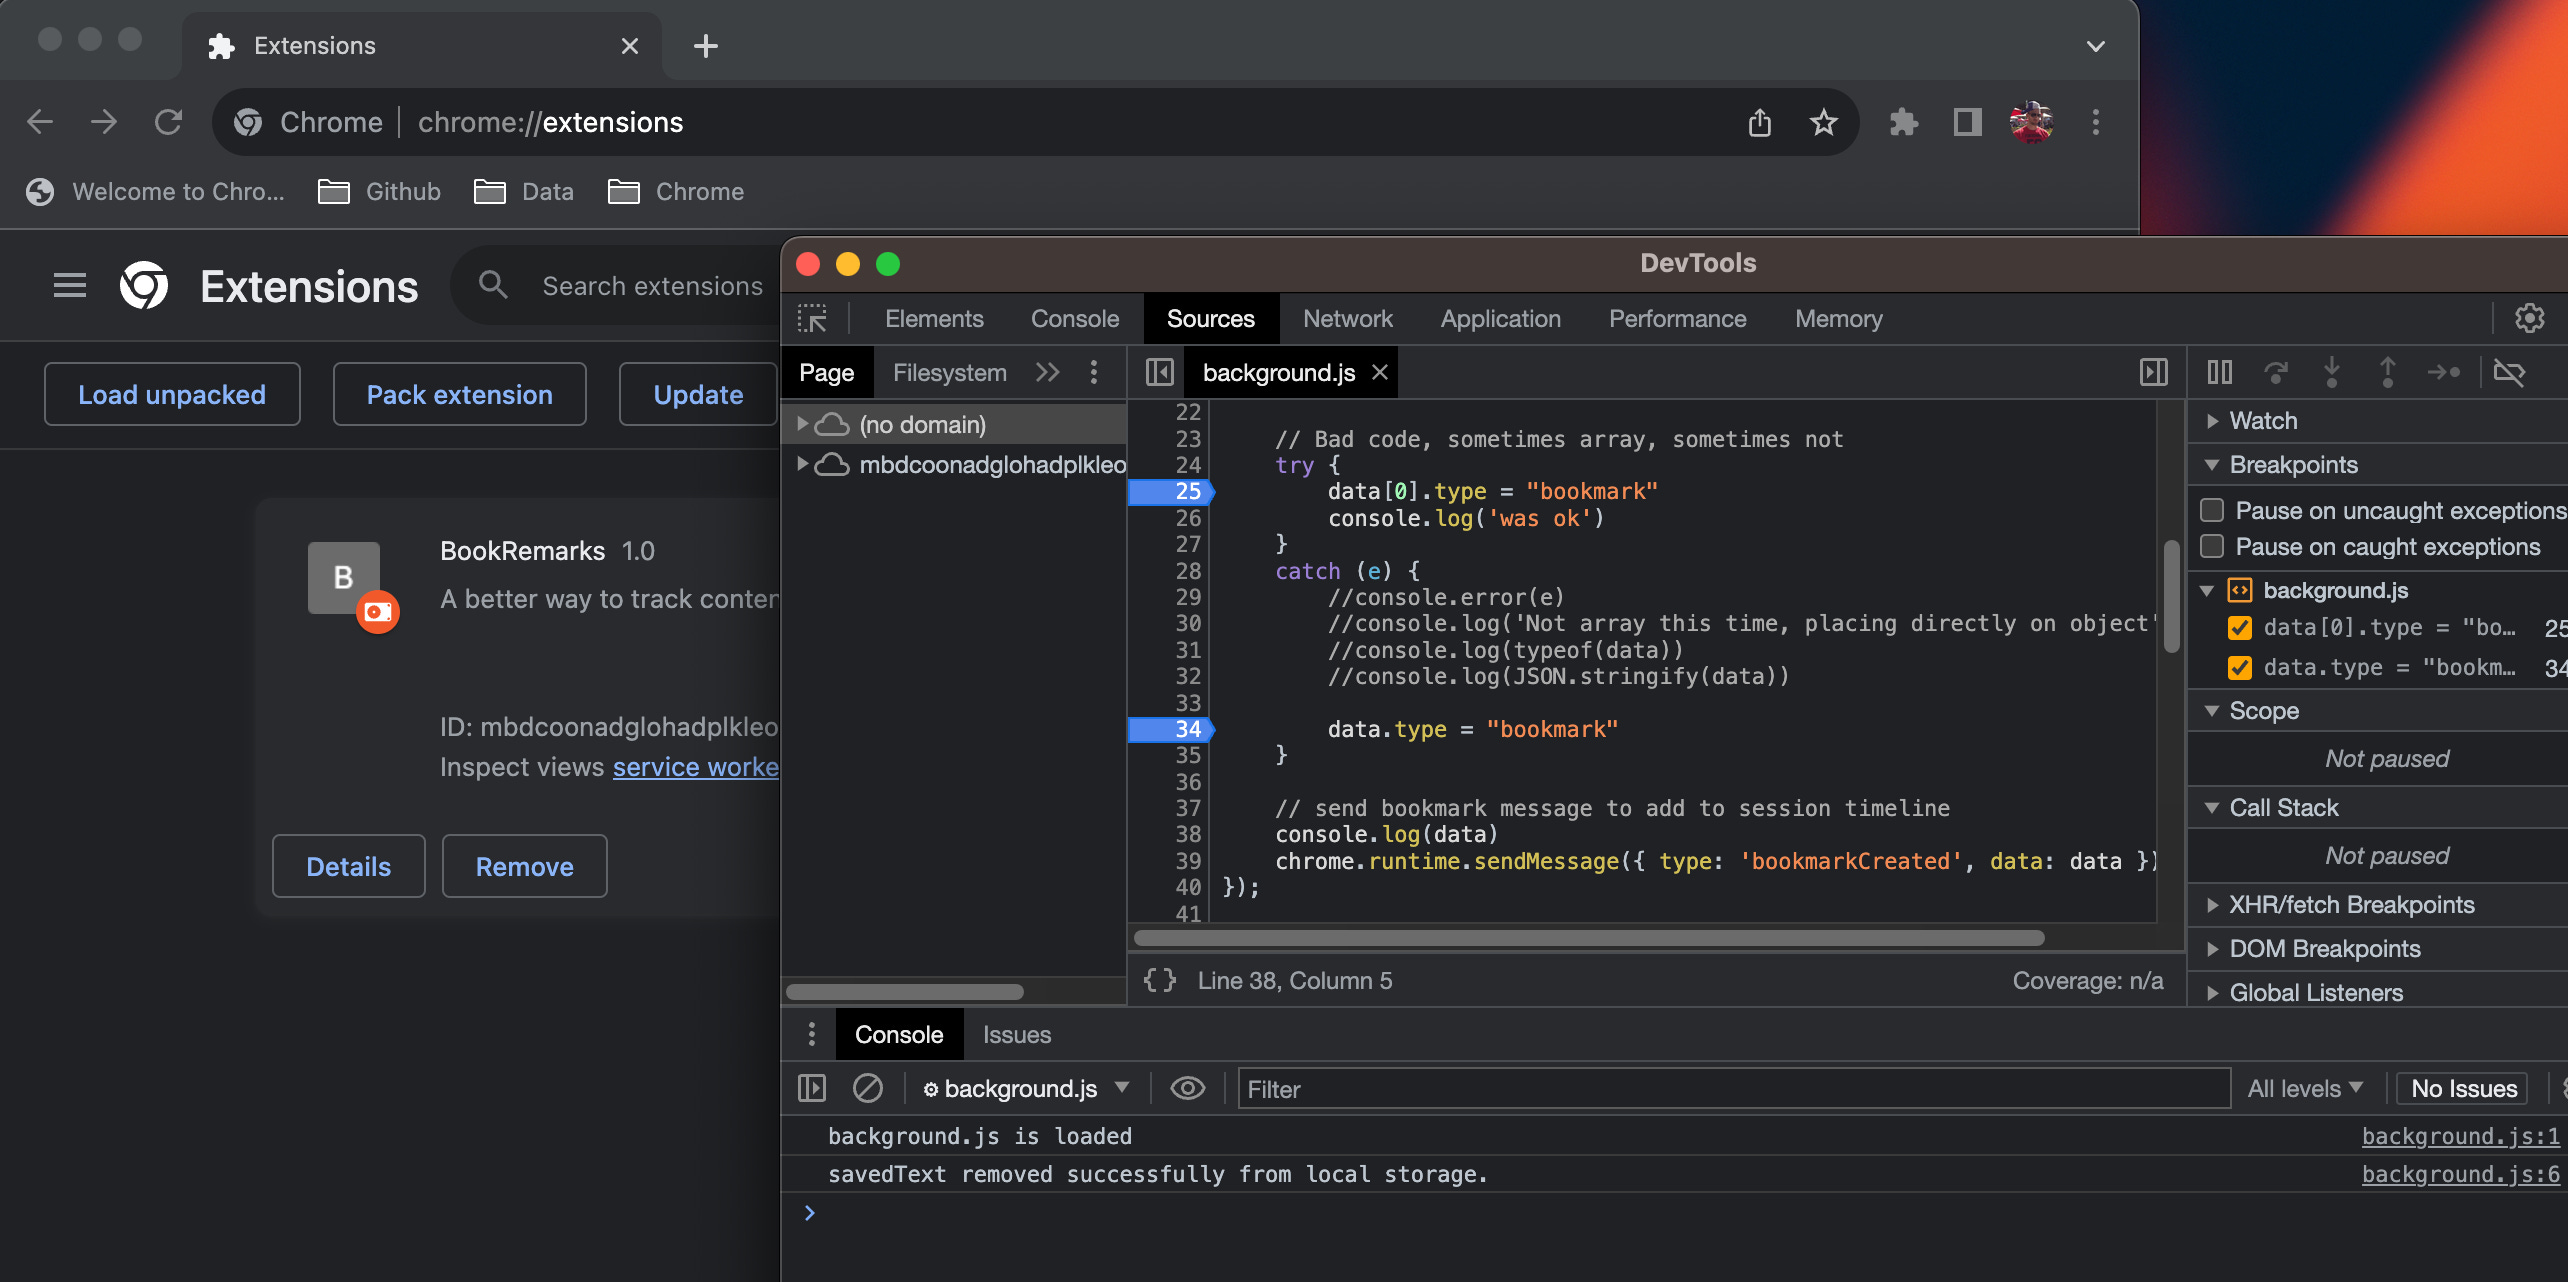
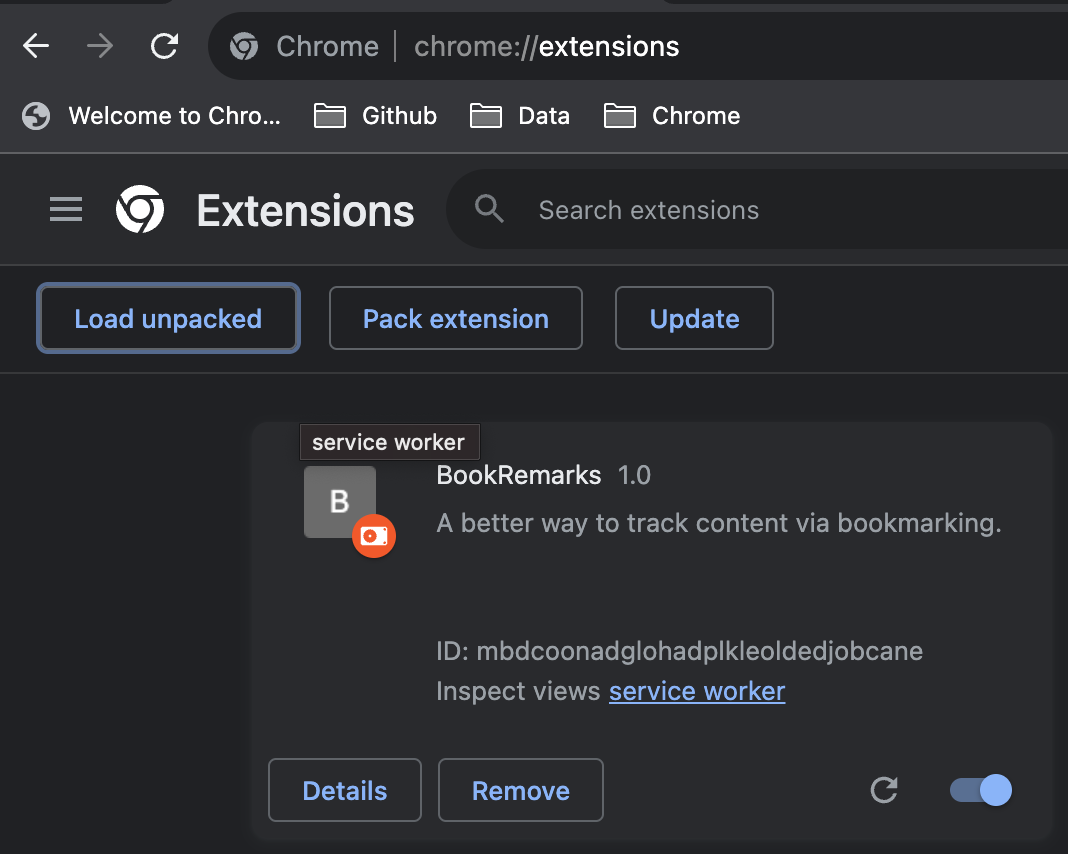
background.js (Background Worker)
In chrome://extensions, click “Inspect views: service worker” to get debugger for just this script.
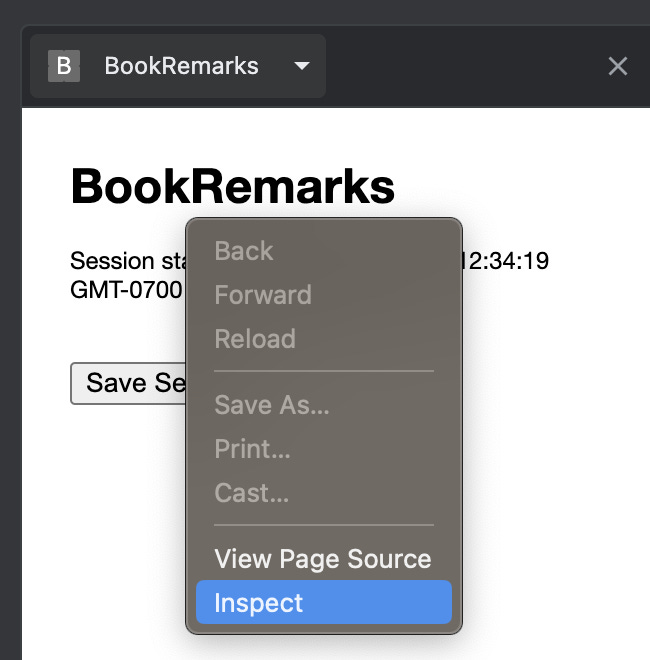
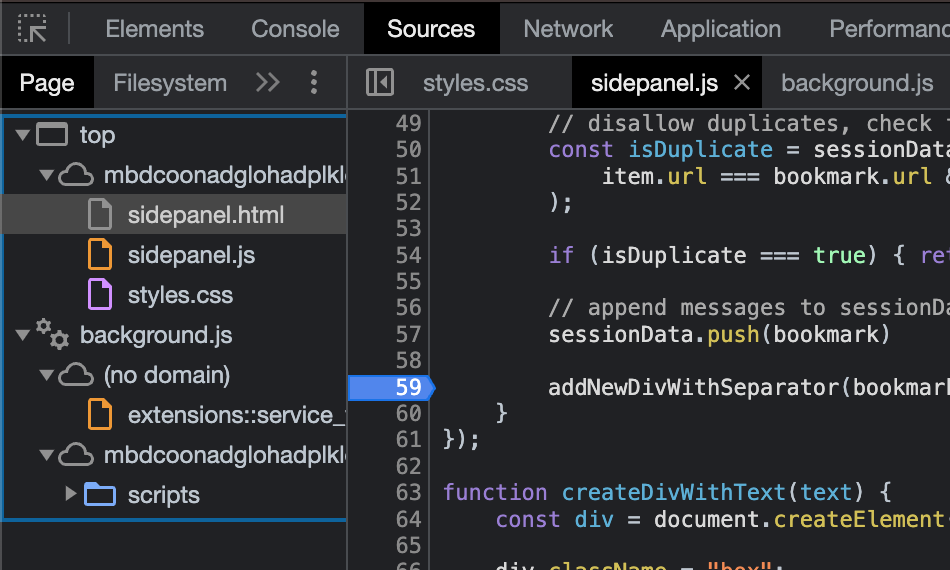
sidepanel.js (Side Panel)
Right-click once open, click inspect.
NOTE: If you have other DevTools running, like one for the background worker, you will be able to see it in this view as well.
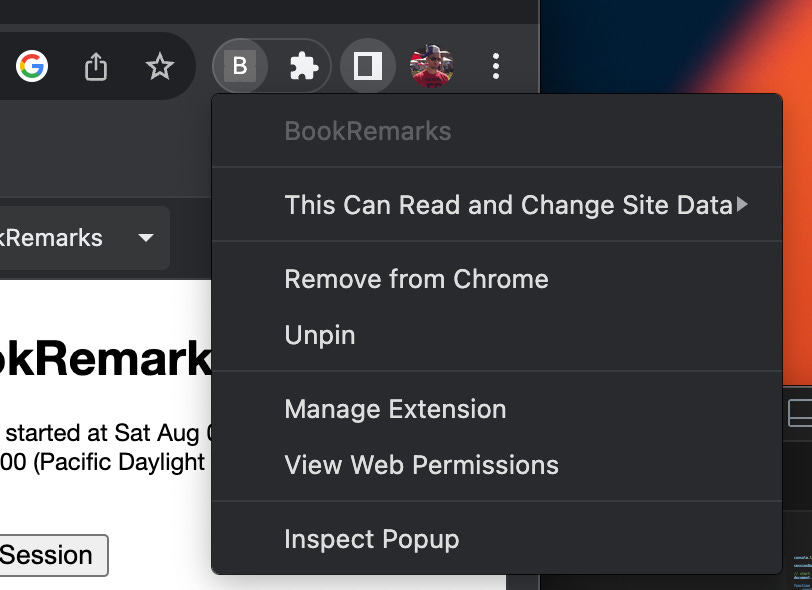
popup.js (Popup)
To debug the popup page and its scripts, simply right-click on the extension icon and select "Inspect Popup".
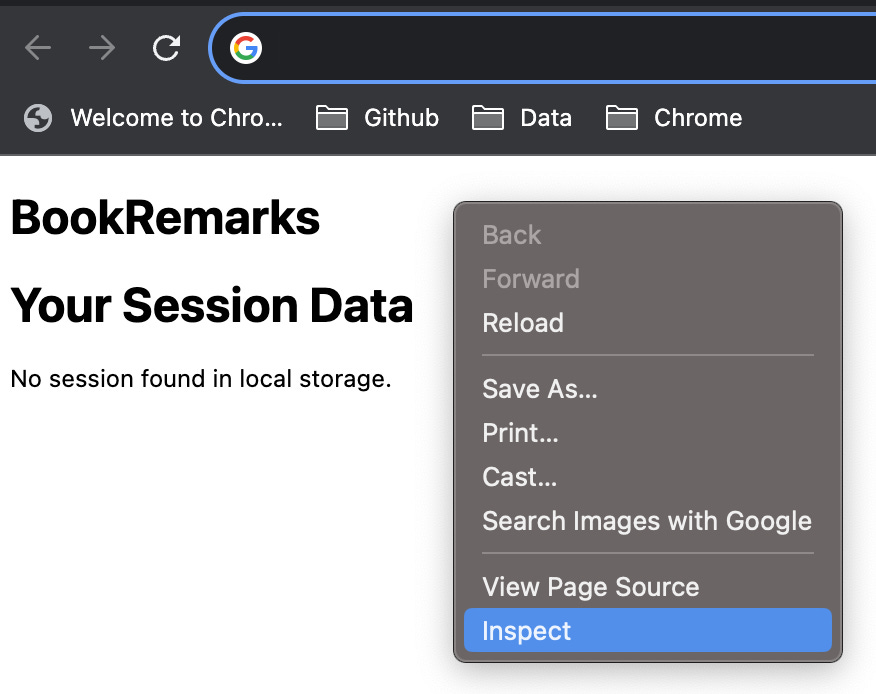
Page Override (Bookmarks, History, about:blank)
These are just regular pages, once your new “blank tab” page is loaded (or history or bookmark replace pages), right-click on the page and go to inspect. From here you can see your resources and scripts as normal.
Summary
Hopefully this page has saved you some time finding this critical development tool. Down the road I will post about how to go about using the debugger to help speed up solving your code issues.